Turn cameras into intelligence for events
Computer vision that measures flow, attention, dwell time and engagement in physical spaces — helping businesses make decisions with real data, not just guesswork.
Aggregated and anonymous data. GDPR & LGPD compliant. Decision-ready reports in 24h.
REAL TESTIMONIALS
Those who experienced it, confirm it
Event CEO, speaker, business owner. Three perspectives, same conclusion.
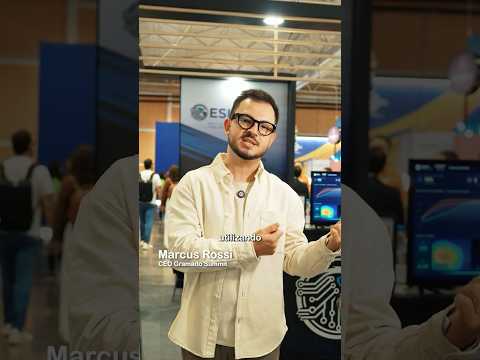
Marcus Rossi
CEO, Gramado Summit
“The main content stages of Gramado Summit are using Eagle's technology. For us it is very, very important — being a content event — to understand the perception, reaction and interaction of people in each of the talks.”
Marcus Rossi
CEO, Gramado Summit
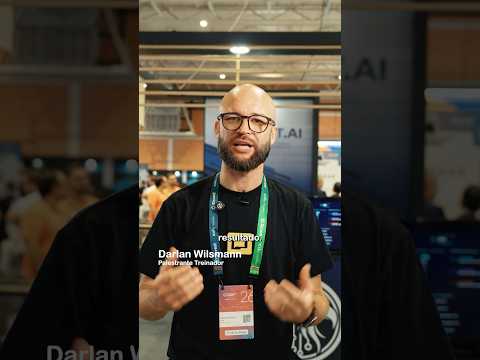
Darlan Wilsmann
Speaker and Trainer · +200 Trainings
“Knowing about engagement will allow me to continuously improve my product and my delivery. At what moment am I losing people's attention? This will make total sense to improve my product, my revenue, to do more business.”
Darlan Wilsmann
Speaker and Trainer · +200 Trainings
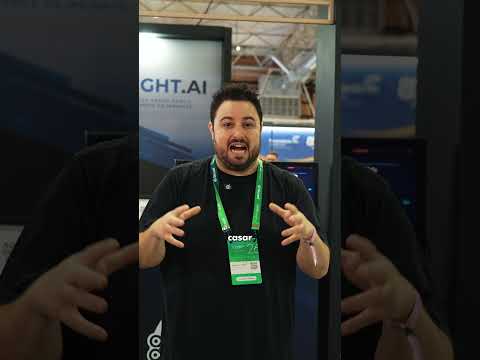
André Salvador
Advertising Professional · Partner at AREA Brand Management
“Super modern, far ahead of many things. Retail, which is still a very skeptical market, needs to wake up and understand that data like this, with AI delivering in real time, can make your business earn much more.”
André Salvador
Advertising Professional · Partner at AREA Brand Management
SUCCESS STORIES
Technology applied, proven results
From the largest innovation summit in Latin America to national retail chains.

Brazilian technology monitors audience in real time at the largest summit in Latin America
Exame followed the debut of eSight.AI at Gramado Summit 2026 and captured how the technology monitors audience engagement in real time.
Gramado Summit 2026
First behavioral audience analysis in real time in Latin America — 3 simultaneous stages, data delivered during the event.
“The main stages of Gramado Summit are using Eagle's technology. For us it's very important, being a content event, to understand the perception and reaction of people in each of the talks.”
stages monitored
attendees analyzed
executive report
Accessories Store — Physical Retail
With flow heatmaps and zone analysis, the team reallocated resources and doubled customer capture rate in less than 60 days.
“With the platform's insights, we doubled customer capture rate in 60 days.”
capture rate
days to result
zones monitored
BEHAVIORAL INTELLIGENCE
What Eagle Sight AI measures
Behavioral data that physical spaces couldn't capture — until now.
People Flow
Precise count of entries, exits and circulation by zone and period
Dwell Time
How long each person or group stays in each area or in front of each content
Engagement
Visual attention, posture and gaze direction indicating real interest level
Spatial Heatmap
Heat map of high and low interest zones throughout the space
Estimated Conversion
Relationship between visitors and actions (entering store, stopping at booth, sitting)
Comparisons
Compare between days, shifts, locations, speakers or different layouts
PROCESS
How it works
From camera to insight in hours, not weeks.
Use your own cameras
Compatible with standard security cameras (IP, CCTV). No additional hardware needed — send the recording or connect to your system.
We process with AI
Our platform processes frame by frame. Detects flow, dwell time, attention and behavior — no facial recognition, GDPR & LGPD compliant.
Real-time dashboard
Access live metrics during events or consolidated analysis for retail. Filters by period, area, shift or speaker.
Decision-ready report
Executive PDF report with actionable insights, benchmarks and strategic recommendations. Delivered within 24 hours post-event.
WHO IT'S FOR
Ideal for anyone who needs data in physical spaces
Events and Activations
- Congresses and conferences
- Trade shows and exhibitions
- Brand activations
- Corporate events
- Event spaces
- Event agencies
Retail and Physical Spaces
- Physical stores and showrooms
- Shopping malls
- Franchises and chains
- Pop-up stores
- Galleries and commercial centers
- Multi-location retailers
Not sure if it fits? Talk to a specialist
PRIVACY & SECURITY
Data that respects people
GDPR & LGPD compliance is not just a tagline — it's how Eagle Sight AI was built from day one.
No facial recognition
Eagle Sight AI analyzes aggregate behavior and flow. It never identifies, tracks or stores data about individuals.
Aggregated and anonymous data
All processed data is statistical and aggregated. No personally identifiable information is generated or stored.
Secure cloud processing
Encrypted infrastructure. Recordings are processed and discarded. Only derived metrics are retained per agreement.
Full GDPR & LGPD compliance
Our process was designed for compliance with GDPR and Brazil's LGPD. Compliance report available upon request.
READY TO START
Want to understand what your cameras can already reveal?
Business intelligence is already in your cameras. Eagle Sight AI is what turns it into actionable data.
It can bring great results for both events and retail. After all, we want to know more and more about people, about our customers, about the movements.
Darlan Wilsmann
Speaker · +200 Trainings across Brazil
No commitment · Response within 24h · Personalized demo