91% of sponsors renew when you prove value with data
Research with event organizers shows: sponsors are open to renewal, but 65% don't renew when expectations aren't met. Prove ROI with objective data: average dwell time, engagement per session, flow per booth.
Tested at Gramado Summit 2026 · Largest summit in Latin America
Real-world proof
Who has tested and approved it
Event CEO and speaker. Two perspectives, same conclusion.
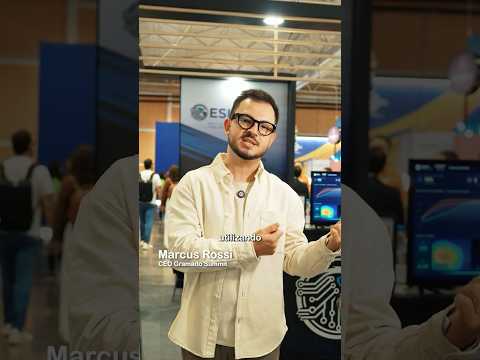
Marcus Rossi
CEO, Gramado Summit
“The main stages of Gramado Summit are using Eagle's technology. For us it's very important to understand the perception and reaction of the people at each of the talks.”
Marcus Rossi
CEO, Gramado Summit
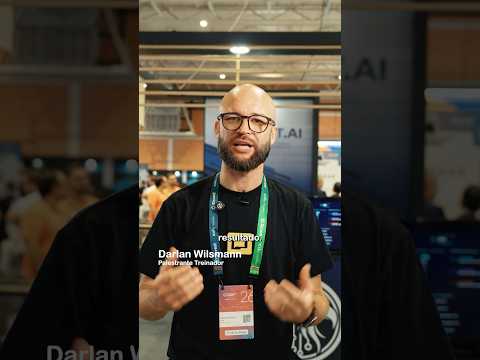
Darlan Wilsmann
Speaker and Trainer · +200 Trainings
“At what moment am I losing people's attention? This will make total sense to improve my product, my revenue, to do more business.”
Darlan Wilsmann
Speaker and Trainer · +200 Trainings
IN THE PRESS
How the media sees Eagle Sight AI
Exame, Brazil's leading business publication, covered our presence at Gramado Summit 2026.
The cost of uncertainty
How much are you losing without objective data?
Surveys applied afterwards
Memory fails. Recency bias. Only those who wanted to answer.
Don't know what worked
Which talk generated more engagement? Which time was better? You guess.
Losing 40% of sponsors
Sponsors renew when they see "12 min average dwell time" vs "it was a success". No data = no renewal.
Schedule too fixed
Noticed something isn't working? Too late to adjust.
Subjective comparison
Speaker A was better than B? Based on what? Applause? Feeling?
Fragmented data
Registrations in one place, attendance in another, feedback in spreadsheets. Nothing connected.
How eSight.AI analyzes
Engagement analyzed in real time
See how we identify, second by second, when audience attention rises or drops — no face cameras, no individual identification.
People flow
We map audience movement across zones, corridors, and booths — identifying high-traffic routes and congestion points.
Dwell time
We measure how long each person stays in each area, revealing which spaces and content generate the most real engagement.
Actionable intelligence
20+ decisions that will increase your revenue
Know which speaker to hire, which time slot to charge 30% more, and where to position premium booths
Real attendance vs. registered
How many actually came
Engagement per minute
Attention throughout the talk
Interest peaks
Moments that captured most
Speaker ranking
Objective comparison
Flow between rooms
Audience movement
Retention rate
How many stayed until the end
Peak hours
Best time for activities
Demographic profile
Estimated age and gender
Proven applications
7 types of events already using it
Congresses and conferences
Compare speakers, optimize schedule, prove ROI to sponsors
Trade shows and exhibitions
Measure traffic per booth, identify hot zones, optimize layout
Product launches
Capture live reactions, identify moment of greatest impact
Corporate events
Employee engagement, training effectiveness
Workshops and training
Participant attention, moments of doubt, effectiveness
Sports events
Fan engagement, zones of greatest emotion, audience flow
Hybrid webinars
Compare in-person vs. online engagement, optimize format
Simple setup
What you need
Technical requirements
- ◆IP cameras (existing or new)
- ◆Internet connection (minimum 5 Mbps per camera)
- ◆Strategic camera positioning
Implementation time
- ◆Setup: 1-2 business days before the event
- ◆Testing: 1 day of validation
- ◆Report: Available 24h after the event
What's included
What you receive
Live dashboard
Track metrics in real-time during the event. Make on-the-fly decisions.
Executive report
Professional PDF with charts, heatmaps, comparisons and recommendations.
Sponsor materials
Objective data on reach and engagement to prove ROI.
Common questions
Frequently asked questions — Events
Ready to get started
Ready to measure your next event?
Schedule a demo and see how it works in practice
No commitment · Response within 24h · Personalized demo